
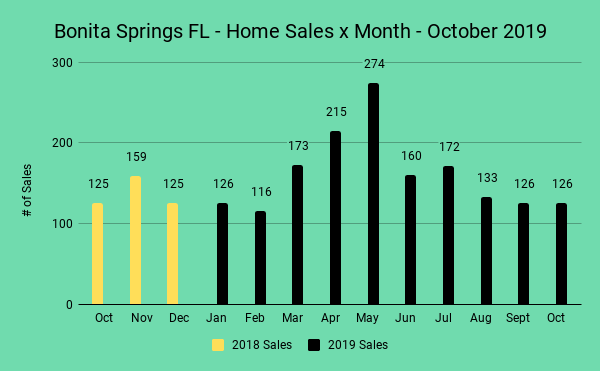
Bonita Springs FL Home Sales x Month - October 2019
Bonita Springs FL home sales were flat in the month of October. The number of homes sold came in at 126 (Oct 2019) same as the previous month, when home sales were at 126 (Sept 2019). One year ago, Bonita Springs FL home sales were at 125 (Oct 2018).
Bonita Springs FL Home Prices x Price Range - October 2019
According to MLS in October, the average sale price of a home in Bonita Springs FL was $447,426. The average sale price for the previous month (Sept 2019) was $391,824.
In order to put the information regarding home sale prices in a more meaningful context, I have taken the total number of homes sold for the month 126 (Oct 2019) and broken that number down by price ranges. Refer to the chart below.

There was a total of 126 transactions in Bonita Springs in the month of October.
The chart below shows the breakdown of those sales x price ranges.
18.3% of the translations were under $200,000.
46% of the transactions were in the price range of $200,000 to $400,000.
22.2% of the transactions were in the price range of $400,000 to $600,000
2.4% of the transactions were in the price range of $600,000 to $800,000
4.0% of the transactions were in the price range of $800,000 to $1,000,000
7.1% of the transactions were in price ranges over $1,000,000.
Bonita Springs FL - Home Sales x Price Range - October 2019
Bonita Springs FL Active Listings x Month - October 2019
The number of active listings in Bonita Springs FL was 1,095 in the month of October. That is 76 more than the previous month (Sept 2019), when the number of active listings was 1019, and represents a increase of 7.5% in the number of active listings on the market. One year ago, (Oct 2018) there were 1,250 active listings on the market in Naples FL.
The number of active listings will likely continue to increase as much as 40% all the way through the 1st quarter of 2020. This is normal market activity for this time of year. Refer to the chart below to see the trend beginning to shape up.

Bonita Springs FL - Inventory & Absorption Rate - October 2019
The number of active listings represents the inventory of homes for sale in Bonita Springs FL. Absorption rate is a term most commonly used in the real estate market to evaluate the rate at which available homes are sold in a specific market during a given time period. It is calculated by dividing the average number of sales per month by the total number of available homes.
Based on a current inventory of 1,095 active listings or homes for sale in Bonita Springs FL, there are 9 months of inventory. A 9 month supply of homes available for sale represents a market that favors buyers.
Summary - October 2019
Bonita Springs FL - Market Report Summary - October 2019
*Not a measure of market appreciation or depreciation.
Curious about what’s happening in your neighborhood? You can create a custom market report to see what’s active, under contract, and sold in your neighborhood!
Considering selling or refinancing your home? Get an INSTANT property valuation now!
Contact us today to find out how we can be of assistance to you! Consultations are FREE.
